Dashboard
Your P&L across every token, over time, in USD.
The dashboard shows how you are doing across every token on the selected chain, in US dollars.
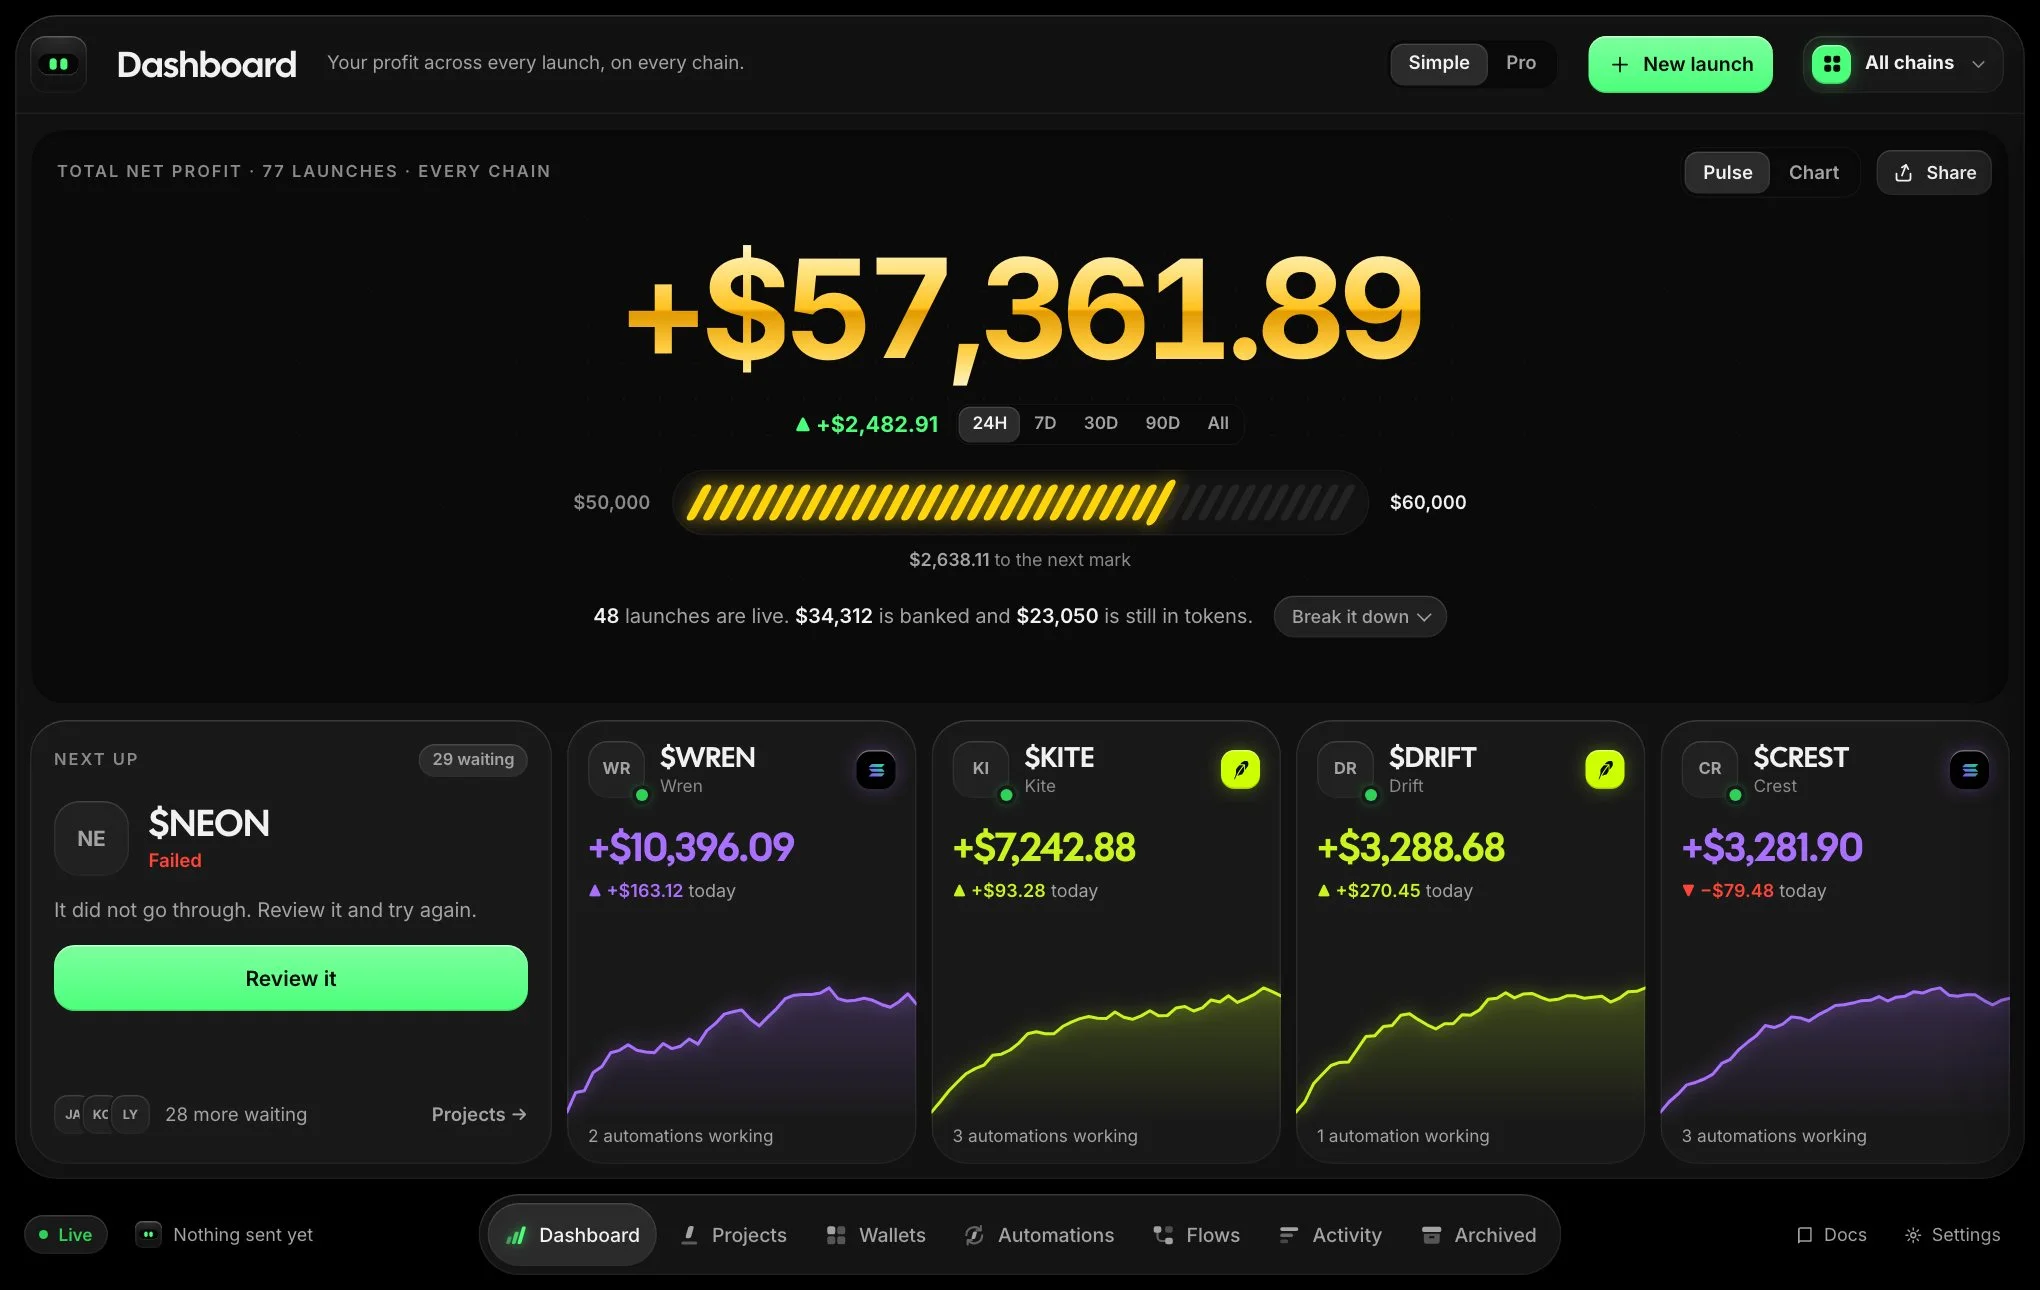
Totals
| Figure | Meaning |
|---|---|
| Net P&L | Realized plus unrealized, all time. |
| Realized | Profit or loss locked in by selling, with the amount realized inside the selected range. |
| Unrealized | What your remaining tokens are worth now, minus what they cost. |
| Volume | Everything you bought and sold. |
| Tokens | Live tokens, launches and total trades. |
P&L over time
The line is your cumulative realized P&L. The bars underneath are what you bought (up) and sold (down) each day. Hover to see a day. Switch the range with 7D, 30D, 90D or All.
By token
Every token you traded, sorted by net P&L, with a link to open it. Share makes a P&L card for that token that you can download or copy, with an option to show only the percentage. On chains with market data, live tokens also show a 24h price line and their 24h change.